You can expect precious metal prices to move partly in response to stock market performance, often rising when equities fall as investors shift into perceived safe havens and falling when markets rally and risk appetite grows. When stocks wobble because of inflation, interest-rate moves, or geopolitical shocks, gold and silver typically gain demand as hedges, while strong bull markets can pull capital away from metals toward higher-return equities.
This post will walk you through how monetary policy, dollar strength, investor behavior, and global crises create both short-term inverses and longer-term nuanced correlations between stocks and metals. You’ll learn when metals act as true safety assets versus when they trade more like commodities, and how to spot signals that matter for your portfolio.
Overview of Stock Market and Precious Metals
You’ll learn how ownership claims and market-driven valuation shape stocks, while physical scarcity, industrial use, and monetary policy drive precious metal prices. Expect contrasts in liquidity, return drivers, and the ways macro events transmit between these asset classes.
Key Differences Between Stocks and Precious Metals
Stocks represent fractional ownership in companies. Your stock returns come from earnings growth, dividends, and investor sentiment tied to company performance. Stocks react quickly to economic data, corporate guidance, and interest-rate expectations.
Precious metals are tangible commodities with no cash flow. You hold metals for scarcity, industrial demand, and monetary roles; price moves stem from supply disruptions, jewelry and industrial demand, and shifts in real interest rates. Metals usually show lower correlation with equities, which can provide portfolio diversification when stocks fall.
Liquidity and trading mechanics differ. Stocks trade on exchanges with transparent order books and settlement cycles. Physical metals may incur premiums, storage fees, and liquidity constraints that affect short-term price behavior.
Types of Precious Metals Influenced by Markets
Gold reacts strongly to real interest rates, inflation expectations, and central bank buying. When real yields fall, gold commonly outperforms because its opportunity cost decreases. You’ll see gold behave as a hedge and a monetary proxy during risk-off periods.
Silver has a dual identity: both an industrial metal and a monetary-like store of value. Industrial demand (electronics, photovoltaics) amplifies silver’s sensitivity to global growth. Expect larger volatility in silver relative to gold because of its smaller market and stronger industrial linkage.
Platinum and palladium are tied to auto-catalyst demand and broader industrial cycles. Cyclical manufacturing slowdowns or emission-regulation shifts can move these prices quickly. Their smaller market sizes mean supply shocks or inventory changes produce outsized price swings.
Historical Context of Market and Metal Prices
In the 1970s, high inflation and weak real yields drove gold to new highs as investors sought real-asset protection. Your metal holdings then benefited from monetary uncertainty and limited central-bank coordination.
During the 2008–2009 financial crisis, gold rose as stocks collapsed; investors sought liquidity and safety, while central-bank easing pushed real rates lower. That pattern repeated in several risk-off episodes, though timing and magnitude varied by event.
Longer-term trends show metals can lead, lag, or move independently of equities depending on the trigger—monetary policy shifts, commodity supply disruptions, or structural demand changes. You should view historical episodes as context, not guarantees of future behavior.
Fundamental Drivers Linking Stock Market Performance and Precious Metals
Stock market moves influence metal prices through changes in risk appetite, liquidity and the relative attractiveness of alternative assets. You’ll see these effects in shifts in investor sentiment, spikes in safe-haven buying during turmoil, and the reallocation of capital between equities and metals.
Investor Sentiment Shifts
Investor sentiment drives short- to medium-term metal price swings. When confidence rises and equities rally, you’ll often see reduced demand for gold and silver as traders favor higher-yielding, growth-oriented assets. That rotation pressures precious metal prices downward, especially for silver, which has stronger industrial exposure.
Conversely, negative sentiment—declining corporate profits, rising volatility, or recession fears—pushes investors toward perceived stores of value. You’ll notice increased inflows to gold-backed ETFs and physical purchases that support price floors. Sentiment-driven flows can amplify moves during earnings seasons, macroeconomic surprises, or geopolitical shocks.
Safe Haven Demand During Market Volatility
Precious metals, particularly gold, serve as a liquidity and value anchor when markets panic. You’ll typically see gold prices rise during sharp equity selloffs and spikes in the VIX as investors seek capital preservation. That safe-haven bid happens regardless of short-term interest rate trends, though real rates modulate the intensity of the response.
Silver and platinum can also benefit, but their industrial links make their safe-haven performance less consistent. During extreme stress, central bank actions and repo market conditions further determine how strong and sustained the metals’ rally becomes.
Capital Flows Between Asset Classes
Capital allocation shifts create measurable pressure across markets. You’ll observe funds moving from equity mutual funds and stock ETFs into metal ETFs, futures, and physical holdings as portfolio managers rebalance risk exposures. Large reallocations by institutional investors, sovereign wealth funds, or central banks can move prices materially.
Interest rate expectations and currency moves influence those flows. Rising real yields tend to attract capital back to bonds and equities, weighting against metals. A weakening dollar, however, often amplifies metal inflows from international buyers and raises local-currency prices, creating a feedback loop that reinforces bullion rallies.
Macroeconomic Factors Affecting Both Markets
Inflation, interest rates, central-bank actions, and cycle shifts directly shape returns in stocks and prices of gold, silver, and other precious metals. You should focus on how these variables change real rates, risk premiums, and liquidity because those channels drive trading and allocation decisions.
Impact of Inflation and Interest Rates
Rising inflation erodes real returns on fixed-income instruments and can push investors toward tangible assets you consider safe, like gold. When headline or core CPI accelerates, gold and silver often gain as a hedge; however, the magnitude depends on whether real interest rates fall or rise.
Nominal rate moves matter too. If central-bank policy rates climb faster than inflation, real rates increase and the opportunity cost of holding non-yielding precious metals rises, which can pressure metal prices. For equities, higher rates raise discount rates and can reduce valuations, particularly for long-duration growth stocks.
Watch breakeven inflation (TIPS spread) and the 10-year real yield as practical indicators. They help you anticipate cross-market flows: falling real yields tend to support metals and can buoy equities that benefit from lower discounting.
Role of Monetary Policy
Central banks set the policy path that shapes liquidity and investor risk appetite you rely on to gauge market direction. Tightening cycles—rate hikes and quantitative tightening—withdraw liquidity, often causing equity volatility and downward pressure on metals if real yields rise.
Conversely, easing cycles increase liquidity through rate cuts and asset purchases, lowering real yields and supporting both stocks and precious metals. Your assessment should track forward guidance, balance-sheet changes, and market-implied rate paths (futures and swaps) rather than just current rates.
Unconventional moves—negative rates or large-scale asset purchases—can weaken the domestic currency and amplify metal price responses. Monitor central-bank communications for shifts in inflation targeting or tolerance for financial stability risks; those changes alter how both asset classes price risk.
Economic Growth and Recession Cycles
Economic expansion typically supports corporate earnings and stock indices, drawing capital into equities and away from defensive assets. During growth periods, industrial metals and silver may benefit from stronger industrial demand, while gold can underperform relative to stocks.
Recessions reverse that pattern. You should expect reduced risk appetite, flight-to-safety flows, and central-bank easing that can lower real yields—conditions that often elevate gold and bullion demand. Equity sectors vary: consumer staples and utilities usually outperform, while cyclicals suffer.
Pay attention to leading indicators—PMIs, unemployment claims, and consumer confidence—and to credit spreads as early warnings. Those metrics help you anticipate shifts in allocation between stocks and precious metals before price moves become broad-based.
Correlation Patterns Between Stock Markets and Precious Metals
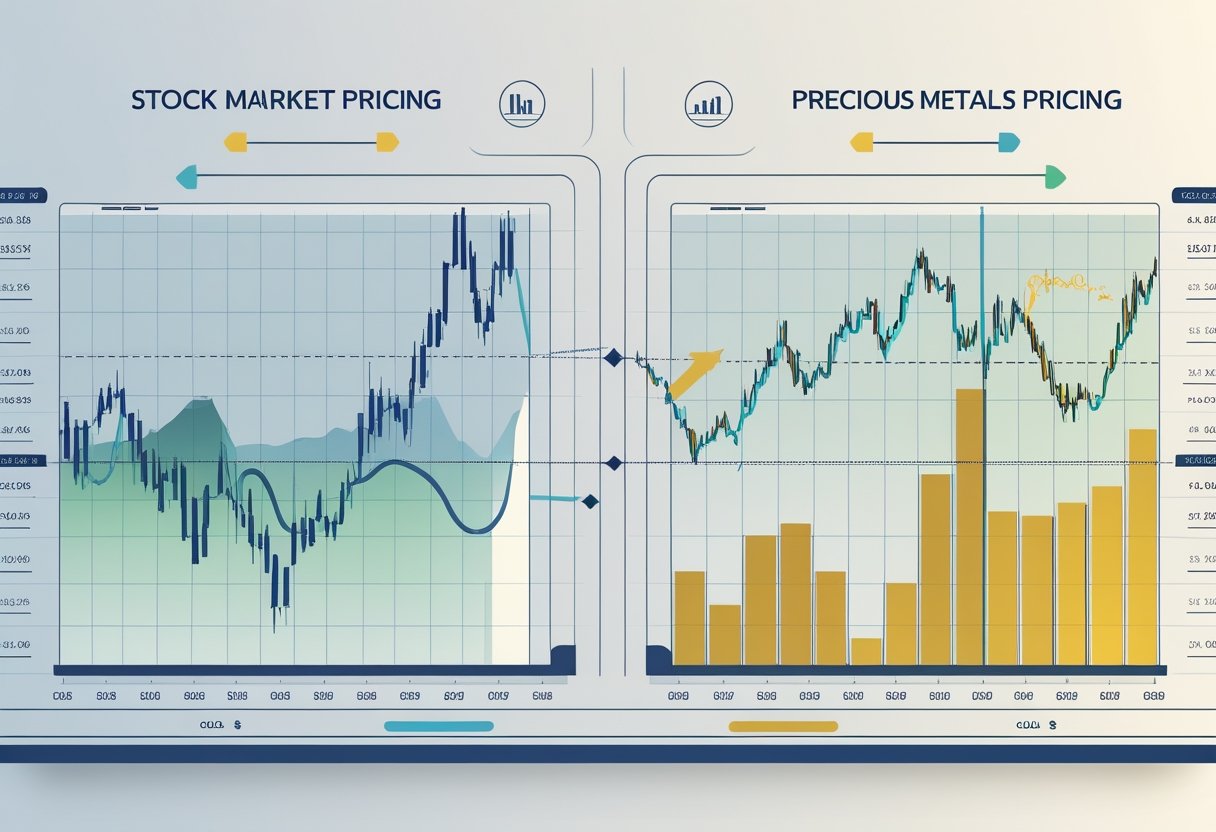
Precious metals and equities show changing relationships: sometimes they move opposite each other, sometimes they rise together, and at other times they decouple for months or years. You’ll find the direction and strength of correlation depend on market stress, monetary policy, and metal-specific fundamentals.
Negative vs Positive Correlations
You often see a negative correlation when investors treat metals—especially gold—as a safe haven.
During equity sell-offs, demand for gold and, less consistently, silver tends to rise, pushing metal prices up while stock indices fall.
Positive correlation appears when global liquidity and risk appetite increase.
When central banks ease policy and equities rally, metals can rise too because investors buy commodities alongside stocks, and mining companies benefit from higher metal prices and rising equity valuations.
Correlation differs by metal and timeframe.
Gold shows the most persistent negative correlation in crises; silver and platinum show mixed correlations because of industrial demand.
Mining stocks often track equities more closely than the underlying metal does.
Periods of Decoupling
Decoupling occurs when metals move independently of stocks for sustained periods.
Examples include episodes when inflation expectations surge: metals react to real-rate changes while equities respond to growth prospects.
Supply-side shocks cause decoupling too.
A disrupted metal supply or changes in industrial demand can lift metal prices even as stocks stagnate.
You must watch frequency and horizon.
Short-term correlations can flip intraday; long-term correlations may trend differently over years.
Wavelet and quantile analyses show correlation strength varies by frequency band and market condition.
Examples of Correlation Shifts
2008–2009: You saw negative correlation strengthen as gold rose while equities collapsed.
Investors moved to safe assets, boosting gold’s role as a hedge.
2016–2019: Easing monetary policy supported both equities and metals, producing a more positive or neutral correlation.
Liquidity-driven rallies lifted commodity prices alongside stocks.
Post‑COVID 2020–2022: Correlations shifted multiple times.
Initial crash increased metal demand; subsequent stimulus and supply-chain issues produced periods where metals and equities rose together and then decoupled as inflation and real rates diverged.
Short-Term Versus Long-Term Effects
You will see sharp, fast swings in precious metal prices when stocks move abruptly, and you will observe slower, structural shifts in metal valuations as economic trends and real returns unfold over years.
Immediate Price Reactions
When equities drop suddenly, you often see gold and silver spike within hours to days as investors shift from risk to safety. This reaction intensifies during equity market crashes, liquidity freezes, or sudden rate-rises expectations because investors rush to hedge or park cash in liquid stores of value.
Speculative flows and algorithmic trading amplify moves. Exchange-traded funds (ETFs) that hold physical metal can experience rapid inflows or outflows, causing price gaps intraday. Currency moves also matter: a quick dollar decline typically raises dollar-priced metal prices the same day.
Expect higher intraday volatility in silver than gold due to smaller market depth and larger industrial exposure. Short-term correlations between stocks and metals can flip sign within sessions, so you must monitor order book liquidity and macro headlines to trade near-term effectively.
Long-Term Performance Trends
Over multi-year horizons, metal prices track real interest rates, inflation expectations, and structural demand from jewelry, industry, and central banks more than day-to-day stock moves. Persistent low or negative real yields boost gold’s appeal as a non-yielding asset; sustained economic expansion tends to favor industrial metals like silver and copper through higher consumption.
Portfolio allocation and central-bank buying create steady demand that decouples metals from short-lived equity rallies. For example, prolonged monetary easing typically supports higher gold prices across quarters or years even if stocks rally concurrently.
You should evaluate long-term metal positions by monitoring secular drivers: global monetary policy stance, durable goods demand, mining supply trends, and changes in official sector reserves. That gives a clearer signal than relying on transient stock-market correlations.
Impact of Global Events and Crises
Global events can push you to reallocate capital between stocks and precious metals, change risk premia, and alter real yields and currency values that drive metal prices.
Financial Crises and Market Shocks
During financial crises, you often see a rapid flight from risk assets into safe-haven metals like gold. Liquidity dries up, forcing leveraged positions to unwind; that can temporarily depress physical metal demand while futures and ETFs spike as investors seek quick exposure.
Central bank actions matter in these moments. When central banks cut rates or launch quantitative easing, real yields typically fall, which raises the opportunity cost of holding cash and bonds relative to gold — supporting higher gold prices. Conversely, emergency margin calls and forced selling can cause short-lived correlations between stocks and metals that differ from normal patterns.
Key metrics to monitor include the VIX (market volatility), real Treasury yields, and central bank balance sheet expansions. These indicators help you anticipate whether metals will rise as a hedge or move with broader deleveraging.
Geopolitical Tensions
You should expect precious metals to react when geopolitical risks threaten supply chains, trade routes, or currency stability. Heightened tensions in energy-producing regions or sanctions that affect mining countries can tighten supply expectations for metals like palladium and platinum, pushing prices higher.
Gold responds more to currency and demand shocks than to physical supply shifts. If geopolitical events weaken the U.S. dollar or raise inflation expectations, gold typically gains. Watch central bank purchases and sovereign reserve shifts, since state-level buying during crises can materially lift prices.
Monitor trade sanctions, export restrictions, and regional conflict intensity. These factors translate quickly into market sentiment and can shift investor flows from equities to metals within days.
Pandemics and Uncertainty
Pandemics create dual shocks: sudden demand collapse and supply-chain disruption. In 2020, you saw silver suffer from industrial demand loss while gold rose as a financial hedge. If manufacturing activity drops, industrial metals fall, but gold benefits from increased safe-haven buying and fiscal stimulus expectations.
You should track mobility data, manufacturing PMIs, and fiscal/monetary stimulus size. Massive stimulus packages lower real rates and increase inflation expectations, supporting gold even if near-term economic weakness pressures equities.
Behavioral effects matter too. Prolonged uncertainty increases retail and institutional accumulation of physical coins and bars, which can create inventory tightness and sustain premiums above paper-market moves.
Role of Institutional and Retail Investors
Institutional and retail investors shape demand, liquidity, and price discovery for precious metals through different trading sizes, horizons, and information access. Their behavior influences short-term volatility and longer-term trend formation in gold and silver markets.
Hedging Strategies
Institutions often use precious metals as explicit hedges against currency weakness, inflation, and correlated equity drawdowns. You’ll see large asset managers allocate to physical bullion, ETFs, and futures to offset macro risk exposures across multi-asset portfolios.
Hedging by institutions tends to be sized and timed: they adjust metal holdings in response to portfolio rebalancing signals, risk-parity rules, or shifts in real yields. That creates predictable flows into or out of metal markets during stress.
Retail hedging is usually smaller and more tactical. You might buy coins, small bars, or leveraged ETFs when you fear market turmoil or want a safe-haven hold. These retail flows increase weekend and end-of-day order imbalances and can amplify short-term spikes in volatility.
Common instruments used:
- Physical bullion (bars, coins) — favored by both for permanent hedge positions.
- ETFs and mutual funds — provide liquidity and low-friction access for institutions and retail.
- Futures and options — preferred by institutions for sizing and precise hedging.
Portfolio Diversification Approaches
Institutions integrate metals to improve risk-adjusted returns and reduce portfolio drawdowns. You will find strategic allocations (1–10% of AUM) to gold within sovereign wealth funds and pensions as a long-term diversifier. Institutions also use tactical metal overlays when correlation between equities and bonds rises, increasing metal weight to preserve capital.
Their large trades and index-driven rebalancing can raise intra-day volatility in metal prices but also deepen market liquidity through regular, predictable flows.
Retail diversification focuses on personal risk tolerance and liquidity needs. You might add metals for emergency value, low counterparty risk, or as insurance against monetary policy errors. Retail positions often stay smaller and less frequently rebalanced, which can create stickier demand and support price floors during prolonged sell-offs.
Both investor types interact: institutional volume magnifies trends; retail participation contributes to episodic spikes and persistence in price moves.
Regional Differences in Market Influence
Regional stock market behavior changes how precious metals price and flow. Factors include currency moves, central bank policy, and local investor demand, which together shape whether metals act as hedges, speculative assets, or stores of value.
US Versus International Stock Markets
In the US, Federal Reserve policy and dollar strength strongly drive gold and silver prices. When the Fed tightens and the dollar rises, yen-denominated and euro-denominated purchasing power for bullion falls, often pressuring dollar-priced precious metals downward. You should watch real yields on US Treasuries; rising real yields make non-yielding gold less attractive and can weaken prices.
International markets add nuance. European and Japanese equity shocks sometimes increase safe-haven flows into gold even when US indices are stable. Currency depreciation in countries outside the US—particularly in emerging currencies—can push local demand for physical metals up, supporting global prices despite muted US stock volatility.
Emerging Markets and Precious Metals Demand
Emerging markets often show stronger physical demand sensitivity to local market and currency conditions. When local equities crash or inflation spikes, retail and institutional buyers in countries like India, China, and Turkey increase purchases of physical gold and silver as protection. You should note seasonal demand patterns too—Indian wedding and festival buying can amplify price moves triggered by local market stress.
Central bank buying in emerging economies also matters. Many of these banks diversify reserves into gold during times of geopolitical tension or when foreign-exchange reserves weaken. That coordinated demand can sustain or lift global metal prices even if developed-market stocks recover.
Forecasting and Analyzing Trends
You will blend price history, macro data, and market sentiment to build forecasts. Focus on repeatable rules, transparent data sources, and clear risk assumptions when you interpret relationships between stocks and precious metals.
Using Technical and Fundamental Analysis
Technical analysis helps you identify momentum shifts and support/resistance that often precede quick moves in gold and silver. Use price charts, moving averages (50/200), RSI for overbought/oversold conditions, and trendlines to time entries and exits. Short-term traders rely on volume spikes and intraday VWAP; longer-term positions track moving-average crossovers and pattern breakouts.
Fundamental analysis links metals to interest rates, real yields, USD strength, and inflation expectations. Monitor central-bank minutes, CPI/PCE releases, and Treasury real yields because rising real yields typically pressure gold. Geopolitical shocks and fiscal policy surprise you with rapid risk-off demand for safe havens. Combine both approaches: let fundamentals set bias and technicals refine timing.
Common Indicators and Data Sources
Use these indicators and sources consistently to avoid data snooping:
- Price & volume: exchange data (COMEX, LBMA) for spot and futures.
- Interest rates and yields: US Treasury daily yield curve and TIPS-derived real yields.
- Inflation metrics: CPI and PCE monthly releases from official statistics.
- USD strength: DXY or trade-weighted dollar indices.
- Sentiment: positioning reports (CFTC Commitments of Traders) and ETF flows (GLD, SLV assets under management).
Supplement with macro calendars and reputable news (central bank releases, major economic prints). Store data in a time-series database and backtest rules on at least 10 years to check regime dependence.
Conclusion
You should expect precious metals to respond to stock market moves, but not in a fixed way. Metals often rise when equities fall sharply, yet that inverse link can weaken during calm markets or when monetary policy drives both asset classes together.
Pay attention to interest rates, inflation, and the dollar. These macro drivers frequently determine whether metals act as a hedge, a speculative play, or a portfolio diversifier for your holdings.
Use metals tactically in your portfolio. Small allocations can reduce downside risk during turmoil, while larger positions expose you to opportunity costs when stocks outperform over long horizons.
Monitor market regime changes and correlations over different timeframes. Short-term connectedness can spike in crises; long-term relationships shift with monetary policy and economic growth.
Key practical considerations:
- Rebalance periodically to maintain your intended exposure.
- Match metal types to your goals: gold for safe‑haven and liquidity, silver for industrial sensitivity.
- Watch central bank actions and real yields for early indications of metal price direction.
You gain a clearer edge by combining macro awareness with disciplined portfolio rules. This helps you use precious metals as tools that complement—rather than replace—your equity strategy.