You likely notice silver prices swing more sharply than gold and wonder why that matters for your portfolio or timing. Silver combines a smaller, less liquid market with heavy industrial demand, so price moves amplify when buyers or sellers change their behavior.
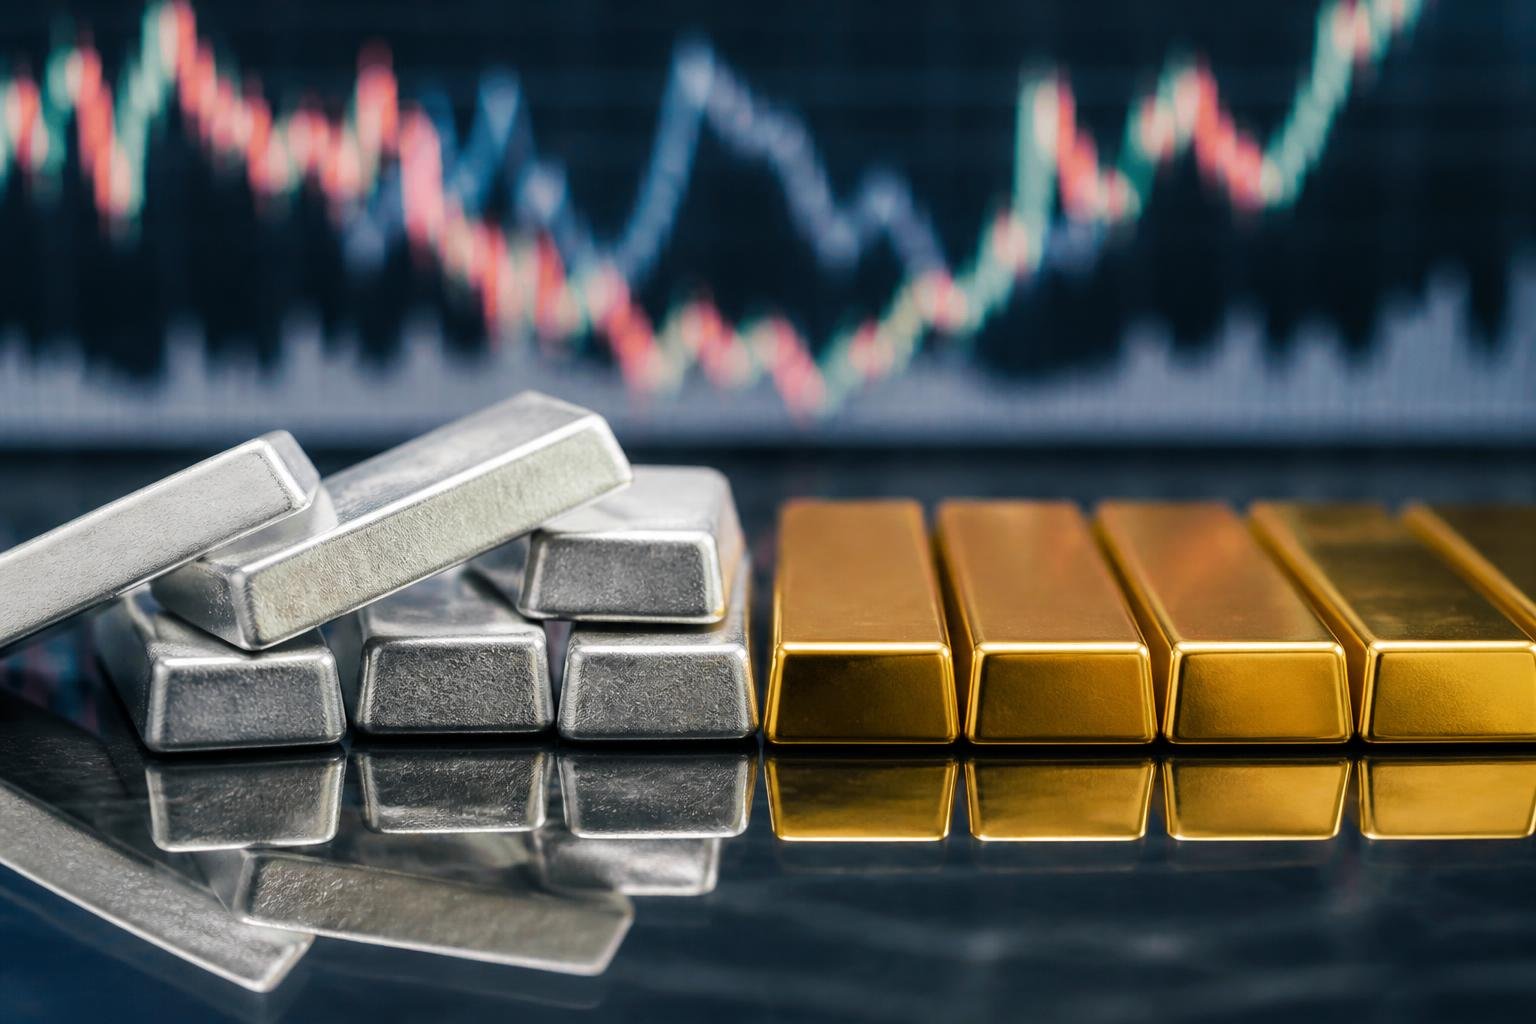
Because silver serves both as an industrial commodity and a precious metal within a much smaller market, it behaves like a higher‑beta version of gold—reacting more strongly to economic shifts, supply changes, and speculative flows. This article will break down market structure, liquidity, supply-demand drivers, trading dynamics, and what that means for volatility and your investment choices.
Fundamental Differences Between Silver and Gold
Silver trades on a much smaller scale, serves large industrial uses, and has different historical roles in money. These facts drive the behavior you see in price charts and in market reactions to economic news.
Physical and Chemical Properties
Silver has higher electrical and thermal conductivity than gold, which makes it indispensable for electronics and solar panels. You should note that silver is more reactive: it tarnishes (forms silver sulfide) in air with sulfur compounds, while gold resists corrosion and oxidation.
Silver’s lower density and lower per-ounce value mean that a given amount of capital buys more physical ounces of silver than gold. That amplifies percentage moves: a $1 move on a cheap-per-ounce metal represents a larger percentage change than the same move on gold.
Gold’s chemical inertness and higher density make it easier to store long term with minimal degradation. You can expect storage, transportation, and insurance costs per dollar of value to be lower for gold than for silver.
Industrial Versus Investment Demand
Silver has a significant industrial demand share—roughly 50% of annual silver consumption goes to industrial applications like photovoltaics, electronics, and catalysts. You should expect silver prices to react to manufacturing cycles, solar-panel demand, and technological shifts. Those swings can be large and fast because industrial purchases are sensitive to short-term demand and inventory levels.
Gold’s demand is dominated by investment, jewelry, and central-bank reserves. Investment and reserve flows are generally larger in monetary value but move more slowly; central banks buy and sell in large, planned blocks. That steadier, portfolio-driven demand dampens gold’s short-term volatility relative to silver.
Silver also sees stronger retail/speculative trading per unit of metal. Smaller investors and traders can create outsized bid/ask imbalances in silver markets, pushing intraday price moves higher than comparable gold moves.
Historical Roles in Finance
Silver historically functioned both as coinage and as an industrial commodity. You should remember that bimetallic standards, widespread silver coinage, and later demonetization reduced silver’s monetary role over time. Those shifts left silver with a hybrid identity: partly store-of-value, partly commodity.
Gold retained its role as the primary monetary metal through modern central-bank reserves and global finance. You will find that gold’s role as a reserve asset gives it a more stable, policy-linked demand base. Central-bank buying and sovereign holdings act as a structural floor under gold prices.
Because silver’s monetary role diminished, its price moves reflect swingy industrial cycles and speculative flows more than central-bank activity. That historical divergence contributes directly to the consistent difference in volatility you observe today.
Market Liquidity and Trading Dynamics
You will see how market size, daily trading activity, and speculative flows create larger price moves in silver than in gold. These factors determine how quickly orders move the market and how persistent price swings become.
Market Size Comparisons
Silver’s market is much smaller than gold’s in both physical and paper markets. Global above-ground silver stocks and annual production are a fraction of gold’s, so a given dollar or tonnage shift moves silver’s price more.
Lower market capitalization and fewer large institutional holders mean thinner order books on exchanges and OTC markets. When a large buyer or seller enters, there’s less depth to absorb the trade without moving price.
You should expect higher sensitivity to supply shocks in silver. Mine disruptions, sudden industrial demand changes, or concentrated sales by a few holders translate into outsized percentage moves. That contrasts with gold, where deeper reserves and broader ownership dilute similar shocks.
Trading Volume and Accessibility
Daily trading volume for silver—both physical deliveries and futures/ETFs—is lower than gold’s on average. Lower turnover means the same trade size creates larger bid-ask swings and slippage for you.
Retail trading has also expanded in silver through smaller-size coins and low-minimum ETFs, increasing participation but not necessarily improving depth. Many silver trades still route through fewer market-makers, which raises execution impact during volatile sessions.
You should factor liquidity when sizing positions. On thin days, orders you place can push intraday prices further and take longer to revert. That makes risk management and limit-order strategies more important in silver than in gold.
Impact of Speculation on Prices
Speculators exert more influence in silver because the market’s smaller size amplifies leveraged positions. Futures and leveraged ETFs allow traders to take large nominal exposure with relatively small capital, which can trigger rapid price moves if multiple participants chase the same direction.
Short squeezes and crowded long positions have historically produced sharp spikes in silver; those events are less common in gold because its deeper market absorbs leverage better. News-driven retail frenzies (social campaigns, sudden hedging demand) also translate into larger percentage moves for silver.
When you trade or hold silver, monitor open interest, concentration of positions, and margin requirements. These metrics help you anticipate when speculative positioning could force abrupt price changes.
Influence of Supply and Demand Drivers
You’ll see how where silver comes from, how industry consumes it, and how inventories move the market. Each factor can push prices quickly because silver’s supply base and end-uses are tightly connected to short-term demand swings.
Sources of New Supply
Primary mining produces roughly 60–65% of annual silver supply; the rest comes from byproduct recovery and recycling. Byproduct silver depends on zinc, lead, copper, and gold mining economics, so a cutback or ramp in those metals can change silver output without miners targeting silver specifically.
Mine closures, permitting delays, or cost inflation can reduce primary supply within a few quarters. Conversely, higher prices can incentivize more recycling and marginal mine restart, which introduces lagged responses. You should note that significant new primary projects take years to develop, so near-term supply reacts slowly to price moves.
Industrial Usage Patterns
Industrial demand now accounts for about half of annual silver consumption. Solar photovoltaics, electronics, and automotive contacts use silver for conductivity and reliability, so growth in solar and electric vehicles can lift baseline demand.
Industrial demand is more cyclical than investment demand. When manufacturing slows, fabricators reduce buying quickly, amplifying price drops. When technology adoption accelerates, purchases can surge. Because industrial purchases are large and lumpy, a few big orders or cancellations move short-term prices more for silver than for gold.
Inventory and Stockpiles
Silver inventories sit in shorter, thinner channels than gold reserves. Exchange-traded products, dealer inventories, and domestic government stockpiles together provide the buffer you rely on for immediate supply, but their absolute size is small relative to global annual demand.
Inventory drawdowns during tight periods force physical buyers to compete with speculators, creating sharp upward moves. Rebuilding stocks when prices fall also feeds volatility. Watch ETF holdings, major refinery backlogs, and warehousing reports; changes in those numbers often precede quick swings in the cash price.
Volatility and Price Behavior
Silver shows larger, more frequent price swings than gold because its market is smaller, a larger share of supply goes to industry, and speculative flows and futures leverage amplify moves. You should expect sharper intraday and multi-week swings in silver, while gold tends to move more steadily on macro signals.
Measuring Volatility in Precious Metals
Volatility commonly appears as standard deviation of returns, beta versus an index, or average true range (ATR).
For silver, historical annualized volatility often exceeds gold’s by a factor of 1.5–3x depending on the period and timeframe you choose. This means daily or weekly percentage moves in silver are typically larger.
Key metrics to watch:
- Standard deviation: compares dispersion of returns over chosen windows (30, 90, 365 days).
- Beta: shows silver’s sensitivity to broader risk assets or gold. Values >1 indicate larger swings.
- ATR / Average daily range: practical for traders sizing stops and position risk.
Use the metric that matches your horizon. Traders rely on ATR or daily volatility; investors look at annualized standard deviation and drawdowns.
Short-Term Versus Long-Term Movements
Short-term silver moves react strongly to industrial data, inventory reports, and shifts in speculative positioning. You’ll see big intraday gaps when futures rolls, ETF flows, or major macro news hit risk sentiment. Tight liquidity in some OTC and physical segments can exaggerate spikes.
Over longer horizons, supply fundamentals and monetary forces shape trends. Industrial demand growth or contraction, mine output changes, and recycling flows influence multi-month to multi-year direction. Central bank behavior impacts gold more, so silver’s long-term correlation with gold fluctuates; expect periods of close tracking and periods of divergence driven by real-economy demand.
Economic and Geopolitical Factors
Macroeconomic trends and geopolitical events affect silver and gold differently because silver combines monetary value with large, direct industrial demand. You should expect sharper swings in silver when manufacturing, trade, or technology shifts occur, while gold reacts more to flight-to-safety flows and central-bank behavior.
Sensitivity to Macroeconomic Changes
Silver’s price reacts strongly to changes in industrial activity. About half of annual silver demand comes from industry—solar panels, electric vehicles, electronics—so manufacturing slowdowns or accelerated clean-energy deployment materially change demand within months. You should track PMI readings, semiconductor output, and solar installation forecasts to gauge near-term silver pressure.
Gold lacks that direct industrial linkage. It moves more on wealth-preservation motives and portfolio allocation. When GDP growth weakens, silver often falls faster because reduced industrial use hits physical demand, while gold can rise as investors seek safe assets. Liquidity differences amplify these moves; smaller silver market depth means similar dollar flows produce larger percentage swings.
Response to Interest Rate Fluctuations
Real interest rates drive opportunity cost for holding non-yielding metals. When inflation-adjusted rates rise, you should expect downward pressure on both metals, but silver typically reacts more severely. Higher rates tighten credit and slow capital-intensive industries, reducing silver’s industrial demand alongside the pure financial disincentive.
Conversely, falling real rates lower the cost of holding precious metals and can spur speculative demand. Gold benefits from central-bank purchases and reserve shifts; silver benefits too but more from leveraged and retail positioning. Watch real-rate moves, Fed guidance, and bond-market pricing—those signals explain much of the short-term divergence between silver and gold price action.
Role of Silver and Gold in Investment Portfolios
Silver and gold serve different practical roles: gold offers price stability and inflation protection, while silver provides higher upside potential tied to industrial demand and market momentum. Your allocation and tactics should reflect those contrasts and your risk tolerance.
Hedging Strategies
You can use gold as a primary hedge against inflation, currency weakness, and systemic risk. Allocate physical bars, ETFs, or sovereign bullion in amounts tied to your liability profile—many investors target 5–15% of liquid assets for that purpose.
Silver can hedge too, but it behaves more like a cyclical commodity. When you use silver for hedging, size positions smaller and set tighter exit rules because its price moves more sharply. Consider using options on silver ETFs to limit downside while keeping upside exposure.
Use allocation blending to manage hedge cost and volatility: hold more gold for stability and a tactical silver tranche for asymmetric upside. Rebalance quarterly or on volatility spikes, and monitor industrial demand indicators (electronics and solar manufacturing) that frequently drive silver swings.
Portfolio Diversification Effects
Gold typically shows lower correlation to equities and bonds during market stress, so it reduces portfolio drawdowns more reliably. If your goal is capital preservation, increase gold weighting; it tends to act like a safe asset during equity crashes and sharp real-rate moves.
Silver’s correlation with equities and industrial cycles is higher and more variable. That raises overall portfolio volatility but can improve returns if you time cyclical recoveries or if silver benefits from rising industrial demand.
Practical implementation: use gold to anchor your low-volatility sleeve and allocate a smaller, tactical silver sleeve for growth. Track rolling correlations and volatility contributions to decide when to trim or add; a 60/40 portfolio often needs only a modest precious-metals tilt to materially change risk characteristics.
Common Misconceptions About Precious Metal Volatility
You might assume that all precious metals move together, but correlation is not identity.
Gold and silver often trend similarly during major macro events, yet silver’s price reacts more strongly to small shifts because its market is smaller and more tied to industrial demand.
Some people believe volatility equals unpredictability.
Volatility measures price swings, not the absence of cause. You can analyze drivers—liquidity, industrial usage, and speculative flows—to form probabilistic views rather than treating movement as random.
Many investors think lower liquidity only affects intraday traders.
Lower liquidity amplifies moves at all time frames. Even long-term positions in silver can see larger percentage changes when a relatively modest buy or sell wave hits the market.
There’s a misconception that industrial demand makes silver inherently risky in the same way as a commodity like oil.
Industrial use adds a structural demand component; it doesn’t mean silver behaves exactly like bulk industrial commodities. Silver combines monetary and industrial roles, which creates a distinct volatility profile.
You may hear that futures and leverage are to blame for all silver swings.
Leverage and derivatives magnify moves, but they work together with market size and investor behavior. Blaming one factor oversimplifies a multi-causal system.
Quick reference—common misbeliefs vs. reality:
- Misbelief: “Gold and silver always move the same.” Reality: Correlated but different magnitudes.
- Misbelief: “Volatility = pure luck.” Reality: Measurable drivers exist.
- Misbelief: “Only day traders suffer from low liquidity.” Reality: Low liquidity affects all horizons.
Outlook for Future Volatility
You should expect silver to remain more volatile than gold in the near to medium term. Its smaller market size and lower liquidity amplify price moves when large trades or shifts in sentiment occur.
Industrial demand will keep adding cyclical risk to silver prices. If global manufacturing or clean‑energy adoption rises, silver can spike; if demand weakens, the metal tends to fall faster than gold.
Speculative flows and ETF activity can cause sharp, short‑term swings. Watch investor positioning metrics and fund inflows; sudden reversals in those can trigger outsized volatility in silver relative to gold.
Central-bank behavior favors gold and reduces its downside risk compared with silver. Since banks hold gold but not silver, changes in monetary policy and reserve buying will likely stabilize gold more than silver.
Key drivers to monitor:
- Macroeconomic indicators (inflation, real rates)
- Industrial demand trends (solar, electronics)
- Liquidity and open interest in futures/ETFs
- Geopolitical shocks and safe‑haven flows
You can manage exposure by sizing positions, using stop orders, or blending metals in your portfolio. Consider volatility‑targeted strategies if you want silver’s upside but want to limit drawdowns.