Gold gets the headlines when precious metals rally, but silver has been doing something harder to explain away. The metal has swung from under $35 an ounce to above $70 within a single year, moves large enough that even seasoned commodities traders have taken notice, as detailed in this account of silver’s volatile 2026 climb to around $73.74 an ounce (https://www.ccn.com/analysis/silver-prediction-2026/). Silver sits at the intersection of two very different markets: a precious metal investors buy as a store of value, and an industrial material that solar manufacturers, electronics makers, and automakers need in physical form.
Silver’s case for attention in 2026 rests on a dual identity that gold doesn’t share: it trades as a monetary hedge and as an industrial input consumed by solar, electronics, and EV manufacturing, all while the market has posted a sixth straight annual supply deficit. That combination makes silver a more complicated asset to read than gold, which is worth understanding before treating any rally as a sure thing. None of this amounts to a price forecast. It’s a look at the mechanics driving silver’s behavior and the signals worth tracking before deciding whether the metal fits your portfolio.
What Makes Silver Different from Gold Right Now?
Silver behaves differently from gold because industrial buyers, not just investors, compete for the same physical metal. Gold’s price moves mostly track investment demand and central bank buying; silver’s price has to clear two markets at once, which is part of why it has outpaced gold’s gains in recent stretches even as it swings harder in both directions.
How Does Silver’s Dual Role Affect Its Price?
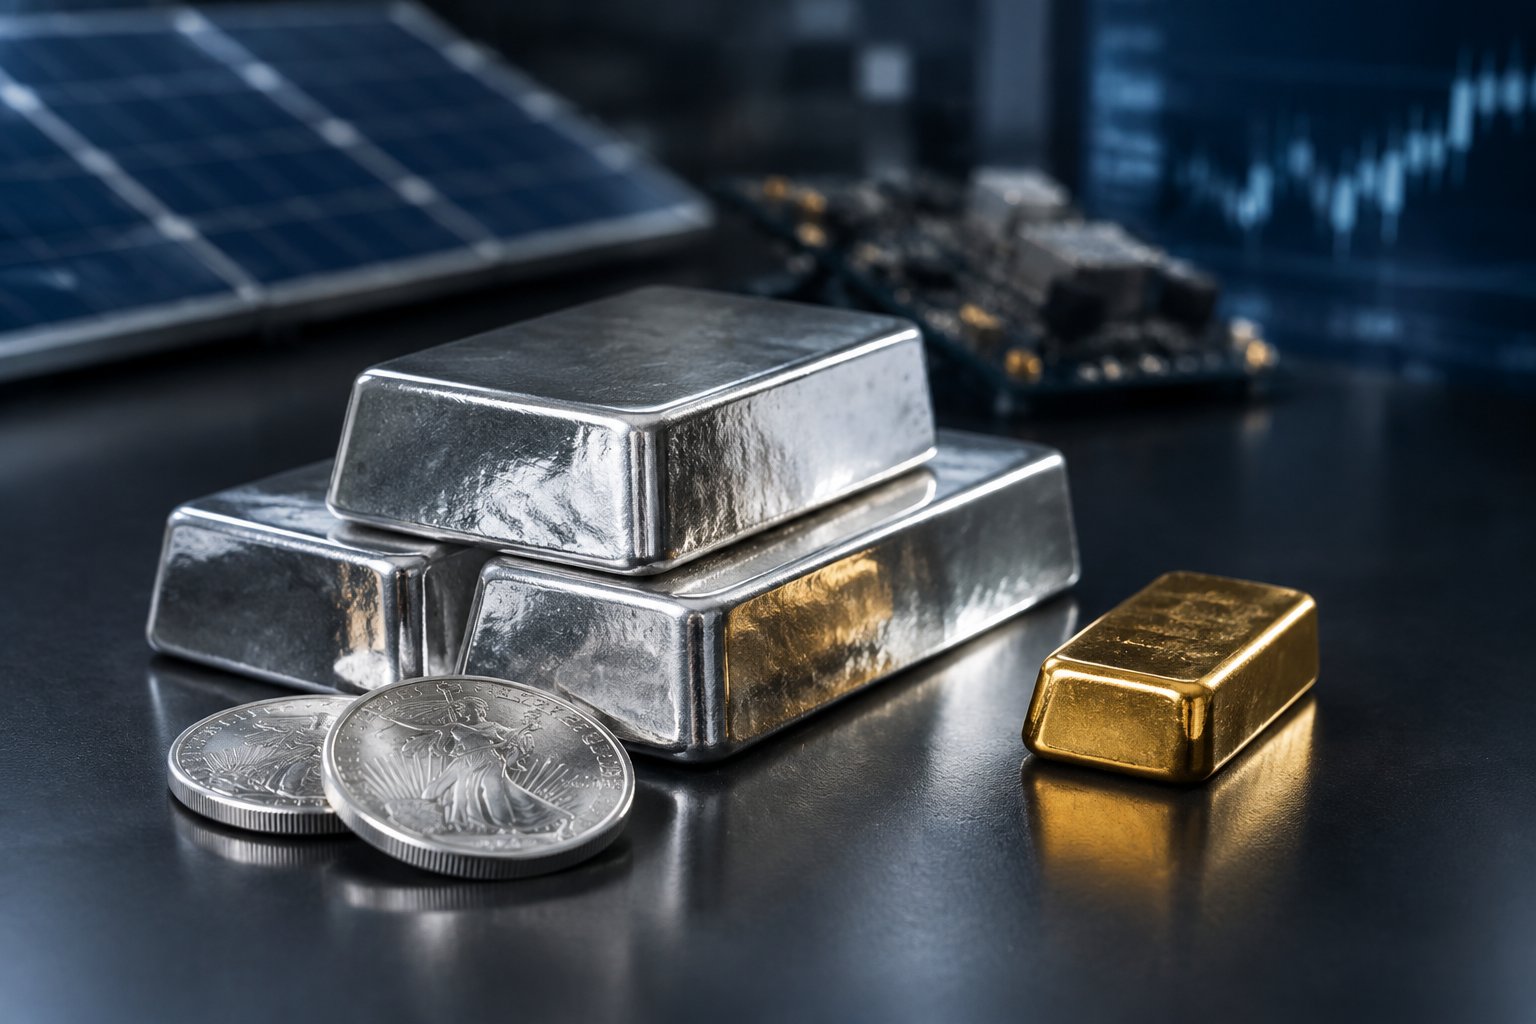
Silver’s price responds to factory orders as much as to investor sentiment. Gold’s industrial use is limited largely to electronics and dental applications, while silver sees extensive demand from electronics and a sharp rise in photovoltaic cell manufacturing, according to CME Group’s overview of precious metals supply and demand (https://www.cmegroup.com/education/courses/introduction-to-precious-metals/understanding-supply-and-demand-precious-metals). That means a slowdown in manufacturing can weigh on silver even when investment demand for precious metals stays strong, a dynamic gold rarely faces to the same degree.
It also means silver can rally on narratives that have nothing to do with gold’s usual drivers, like a surge in solar installations or an EV production run. A financial planner quoted in USA Today’s comparison of gold and silver investing puts it plainly: silver “has usually attracted investors who are more speculative on economic growth or who want exposure to industrial commodities,” a framing that separates it clearly from gold’s role as a slower-moving store of value, as discussed in this USA Today breakdown of gold versus silver investing (https://www.usatoday.com/story/money/money-management/investing/silver-vs-gold-investing/89087962007/).
What Can the Gold-to-Silver Ratio and Can’t It Tell Investors?
The gold-to-silver ratio tells you how many ounces of silver it takes to buy one ounce of gold, nothing more. At a gold price near $5,000 and silver near $50, the ratio sits around 100:1; a higher ratio has historically been read as a signal that silver is cheap relative to gold, and a lower one as the opposite, per USA Today’s explanation of the gold-silver ratio (https://www.usatoday.com/story/money/money-management/investing/silver-vs-gold-investing/89087962007/).
That reading carries less weight than it once did. Both metals functioned mainly as monetary assets for most of history, but silver’s industrial consumption has grown enough that the ratio no longer reflects two comparable assets, the same analysis notes. A stretched ratio might reflect a genuine mispricing, or it might reflect the fact that silver and gold are increasingly priced by different forces altogether. For readers who want a deeper walkthrough of how the ratio is calculated and used, this explainer on the gold-silver ratio’s investment significance lays out the mechanics in more detail (https://metalsmint.com/understanding-the-gold-silver-ratio-and-its-investment-significance/).
Where Is Industrial Demand for Silver Growing?
Industrial demand for silver has been setting records even as prices climb, driven by solar manufacturing, electric vehicles, electronics, and data center buildouts. Total silver demand fell 3% to 1.16 billion ounces in 2024, but industrial demand bucked that trend and posted another record year, underpinned by what the Silver Institute’s supply and demand data describes as structural gains in photovoltaics, automotive, and grid infrastructure (https://silverinstitute.org/silver-supply-demand/).
Why Does Solar Panel Manufacturing Use Silver?
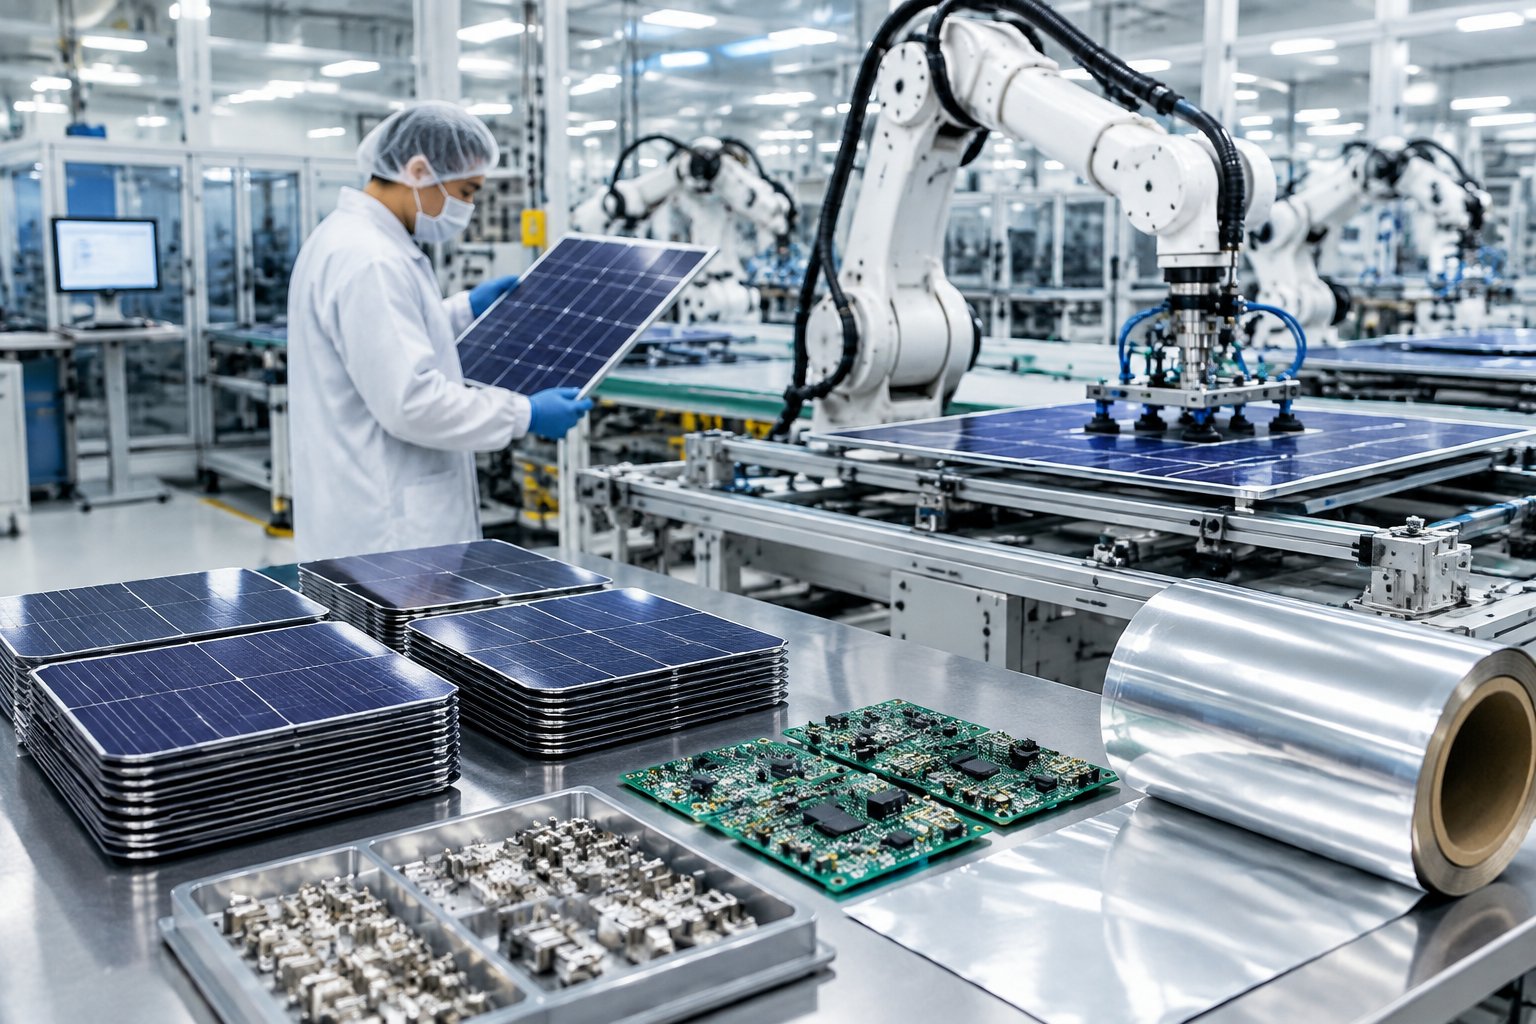
Solar cells rely on silver paste to conduct electricity across each panel, making silver a functional input rather than a substitutable one in most current cell designs. The Silver Institute’s 2024 data attributes much of the demand growth to “the green economy flowing through from the PV and automotive sectors and grid infrastructure development,” with notable advancements in the PV segment also reducing how much silver each panel requires, according to the same Silver Institute report (https://silverinstitute.org/silver-supply-demand/).
That thrifting trend matters. Manufacturers have gotten better at using less silver per panel over time, which tempers (without erasing) the demand growth tied to rising solar installation volumes. Even with thinner silver loadings, the Silver Institute projects industrial demand will keep climbing as offtake from high-growth technology sectors accelerates over the next five years, per this reporting on silver industrial demand forecasts (https://silverseek.com/article/silver-industrial-demand-expected-grow-despite-higher-prices).
How Do Electric Vehicles, Electronics, and Data Centers Add Demand?
Electric vehicles use more silver per unit than traditional internal combustion cars, largely in wiring, sensors, and battery-related components, adding a second major demand stream alongside solar. USA Today’s gold-versus-silver comparison groups EVs and EV infrastructure with electronics and industrial manufacturing as the three sectors most responsible for silver’s industrial pull, noting that circuit boards, semiconductors, and medical devices all depend on the metal (https://www.usatoday.com/story/money/money-management/investing/silver-vs-gold-investing/89087962007/).
Electronics and electrical demand hit a record in 2024, a gain the Silver Institute links partly to AI-related applications alongside the broader green economy buildout (https://silverinstitute.org/silver-supply-demand/). Data center expansion, tied to that same AI infrastructure growth, adds a demand source that barely registered in silver markets a decade ago.
Why Has Silver Supply Struggled to Keep Up?
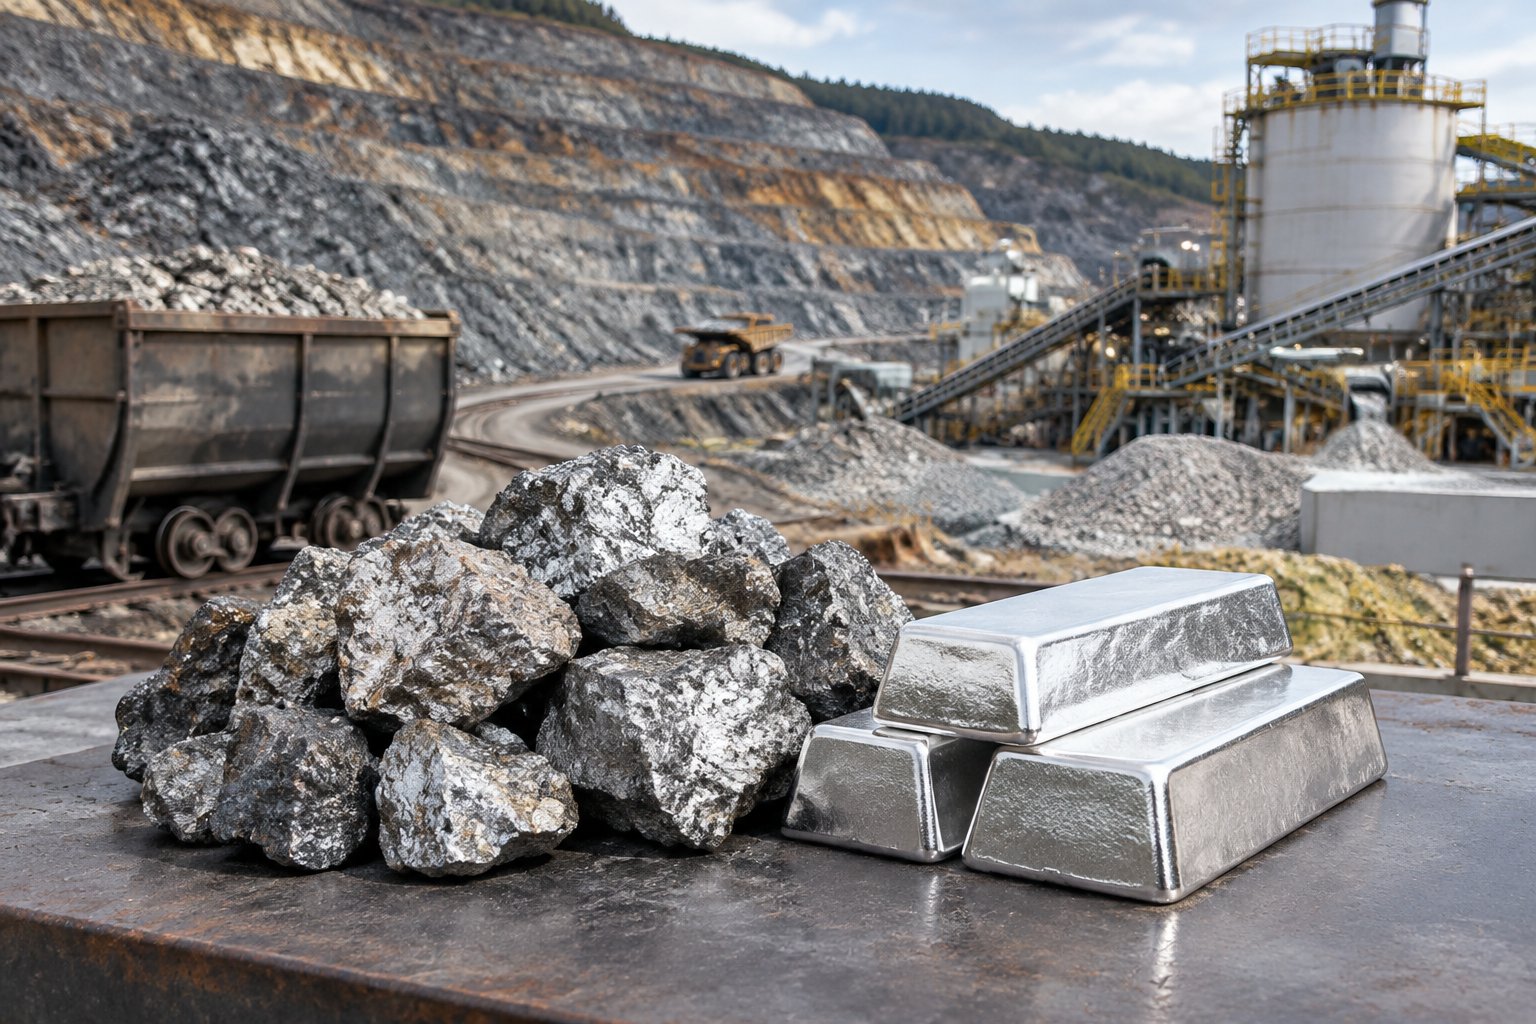
Silver supply has lagged demand for six consecutive years because most silver mining happens as a byproduct of other metals, not as a primary target of its own. Miners dig for copper, lead, zinc, and gold first; silver comes out of the ground as an incidental output, which means a rising silver price does very little to pull new supply onto the market quickly.
Why Can’t Mines Quickly Raise Output?
Roughly 70% of silver output comes as a byproduct of mines whose economics are driven by copper, lead, zinc, or gold prices, not silver’s, meaning the biggest lever on silver supply barely responds to silver’s own price swings. Global silver mine production rose just 0.9% in 2024, to 819.7 million ounces, with gains from Australian lead and zinc mines and a production recovery in Mexico offset partly by an 8.8 million ounce decline in Chile, according to the Silver Institute’s World Silver Survey data (https://silverinstitute.org/silver-supply-demand/).
That kind of incremental, uneven growth is typical for a byproduct metal. Even a sustained price rally doesn’t change mine-planning decisions overnight, since those decisions hinge on copper or zinc economics far more than on silver’s spot price.
Do Market Deficits Mean Physical Silver Is Scarce?
A market deficit means demand has exceeded new mine and recycled supply for six straight years, not that silver bullion has disappeared from dealer shelves. The shortfall widened from 40.3 million ounces in 2025 to a projected 46.3 million ounces in 2026, according to Silver Institute and Metals Focus figures cited in this analysis of the widening silver deficit (https://goldsilver.com/learn/investing-in-silver/silver-supply-and-demand/).
Those deficits get filled by drawing down above-ground stocks, the metal sitting in vaults, ETFs, and industrial inventories built up over decades. That’s a meaningfully different condition from an outright shortage where buyers can’t find metal to purchase at any price. Recycling actually rose 6% in 2024 to a 12-year high of 193.9 million ounces, partly as firmer prices encouraged more silverware recycling in Western markets, per the Silver Institute (https://silverinstitute.org/silver-supply-demand/). Readers weighing whether current prices already reflect this dynamic may find this look at whether silver remains undervalued useful context (https://metalsmint.com/is-silver-still-undervalued/).
How Do Investment Flows and Monetary Conditions Move Silver?
Interest rates and the U.S. dollar move silver through the same channel they move gold, but silver’s smaller market amplifies the swing. Higher rates make interest-bearing assets like bonds more attractive relative to metals that pay no yield, while a stronger dollar makes dollar-priced silver costlier for buyers overseas, both of which can pressure prices, as CBS News lays out in its analysis of how a Fed rate hike could affect gold and silver (https://www.cbsnews.com/news/what-fed-rate-hike-means-for-gold-silver-prices-september-2026/).
What Do Interest Rates and the U.S. Dollar Change?
Rate hikes raise the opportunity cost of holding silver, since the metal generates no interest or dividend. The Federal Reserve held its benchmark rate at 3.50% to 3.75% at its July 2026 meeting, with three policymakers pushing for a quarter-point increase, and the Consumer Price Index rose 3.4% annually in August, keeping inflation above the Fed’s target and tightening pressure alive, according to CBS News’s coverage of the Fed’s rate decisions this year (https://www.cbsnews.com/news/what-fed-rate-hike-means-for-gold-silver-prices-september-2026/).
Silver’s industrial link adds a second channel. If higher rates slow manufacturing activity, weaker industrial demand compounds the usual pressure that higher rates put on non-yielding assets, the same reporting notes. That layered sensitivity helps explain why silver can underperform gold during growth scares even when both face the same rate environment.
What Can Futures Prices and Regional Premiums Reveal?
Futures markets and regional price premiums show where physical silver is tightest at a given moment. When Shanghai silver prices or regional premiums diverge meaningfully from London or COMEX pricing, it signals localized tightness in physical delivery rather than a shift in silver’s global fundamentals.
Futures pricing also reflects how much of an expected rate move is already priced in. CBS News points out that investors often adjust positions before a Fed decision lands, so some anticipated impact shows up in futures and spot prices before the announcement itself (https://www.cbsnews.com/news/what-fed-rate-hike-means-for-gold-silver-prices-september-2026/). Watching the gap between futures and spot, alongside regional premiums, gives a more current read on physical-market stress than the spot price alone.
What Could Undermine the Case for Silver?
Silver’s industrial demand story could weaken if manufacturers keep reducing how much silver each solar panel or electronic component requires, or if a broader economic slowdown cuts into factory orders. Thrifting and substitution have already trimmed silver loadings in photovoltaic cells, and the Silver Institute’s 2024 data notes this reduction has been sharp enough to show up in aggregate demand figures even as total installations grow (https://silverinstitute.org/silver-supply-demand/).
Could Weaker Manufacturing or Less Silver per Solar Panel Reduce Demand?
A manufacturing slowdown hits silver twice over, through weaker industrial offtake and through the same rate and currency pressures that weigh on gold. CBS News’s analysis notes that if higher interest rates slow economic activity broadly, “weaker industrial demand could put additional pressure on silver” beyond what gold typically experiences (https://www.cbsnews.com/news/what-fed-rate-hike-means-for-gold-silver-prices-september-2026/).
Continued thrifting in solar cell design works in the same direction. Even strong installation growth doesn’t guarantee proportional silver demand growth if each panel needs less metal than the last generation did.
Which Price and Physical-Market Signals Are Worth Watching?
Physical-market premiums, dealer spreads, and the pace of above-ground stock drawdowns are more revealing than the headline spot price alone. Silver premiums over spot can run two to three times what gold dealers typically charge, and those spreads tend to widen further during volatile stretches, according to a Zacks Investment Research strategist cited in USA Today’s gold-silver comparison (https://www.usatoday.com/story/money/money-management/investing/silver-vs-gold-investing/89087962007/).
Daily price swings also carry information. Silver has moved 4% to 6% in a single day, with swings sometimes exceeding 10%, compared with gold’s typical 2% to 3% daily range, the same source notes. A string of outsized daily moves in either direction says more about shifting positioning than any single price level does.
Silver’s Appeal Depends on More Than a Rally
Silver’s case rests on a structure gold doesn’t share: a market where factory demand and investor appetite compete for the same physical metal, against a backdrop of six consecutive annual supply deficits. That structure explains why silver has moved harder than gold in both directions, and why a stretched gold-to-silver ratio alone doesn’t settle whether silver is cheap.
The more useful habit is tracking the specific indicators behind the headlines: industrial consumption figures from the Silver Institute, physical premiums and dealer spreads, and the path of interest rates and the dollar. Those signals tell you more about where silver stands than any single price milestone, and they’ll keep mattering long after this particular rally runs its course.