The gold to silver ratio tells you how many troy ounces of silver equal the price of one troy ounce of gold, calculated by dividing gold’s price by silver’s price. You use it to compare the relative value of these precious metals at the same moment.
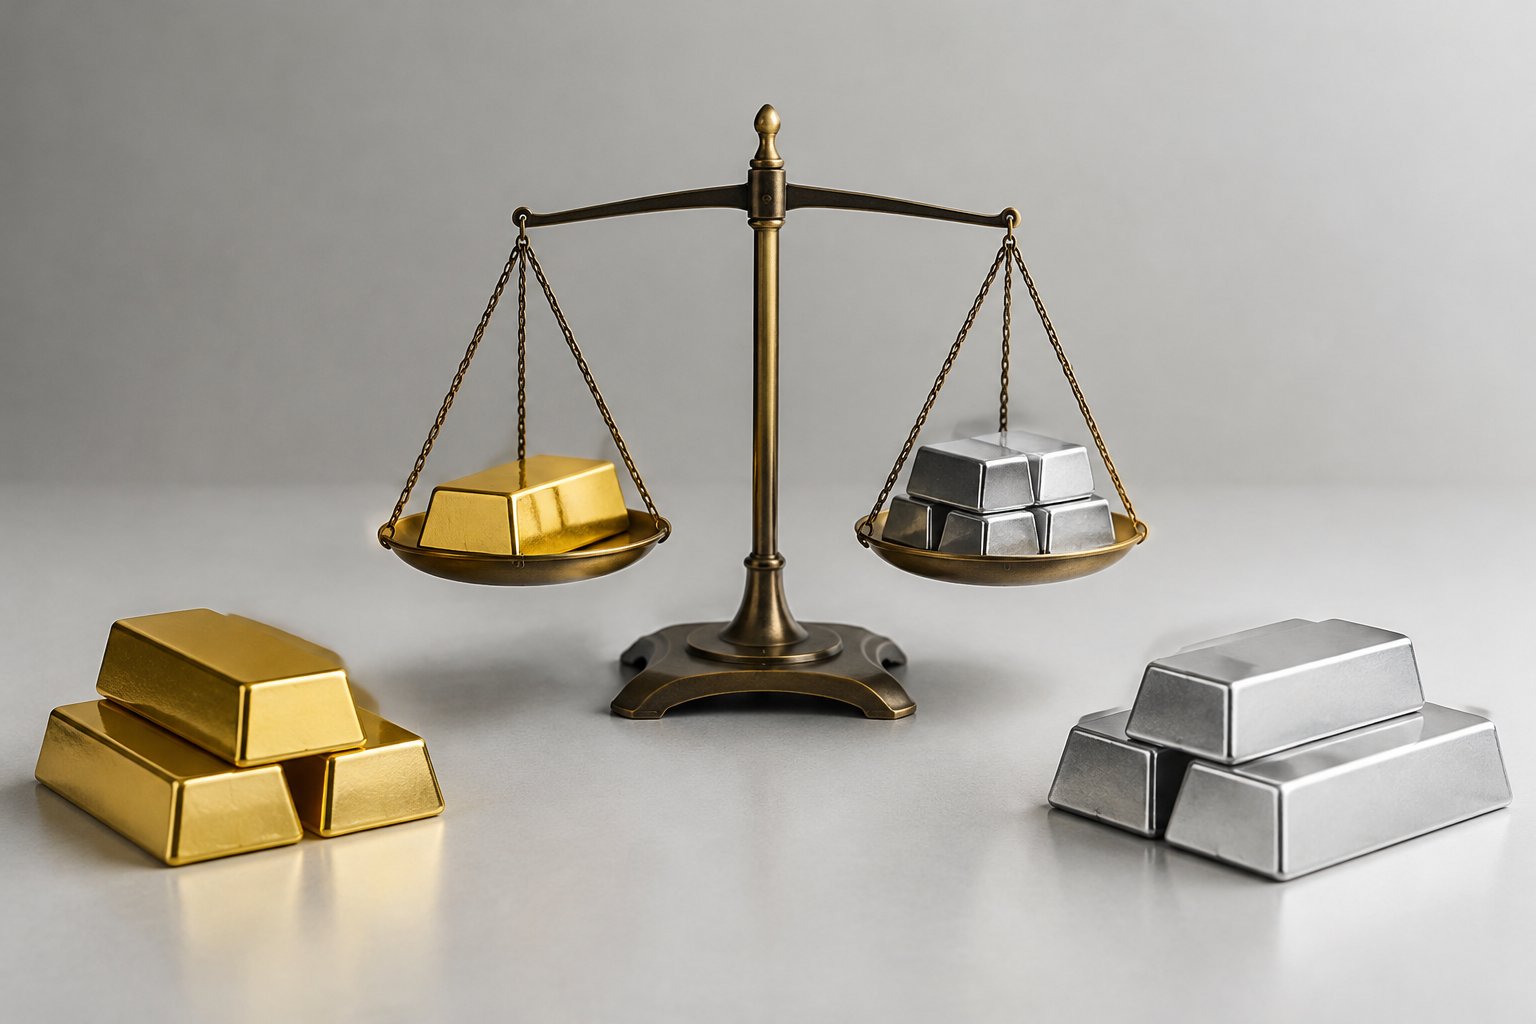
A high reading means you need more silver ounces to match one gold ounce. That gives you useful context when choosing between gold and silver, but calling silver “cheap” requires care: you are measuring its price relative to gold, and either metal might still be expensive in dollar terms.
For physical bullion, your actual exchange also depends on the prices a dealer will pay and charge. The spot-price ratio gives you a starting point; your transaction costs determine how many ounces you receive.
How Do You Calculate the Ratio?
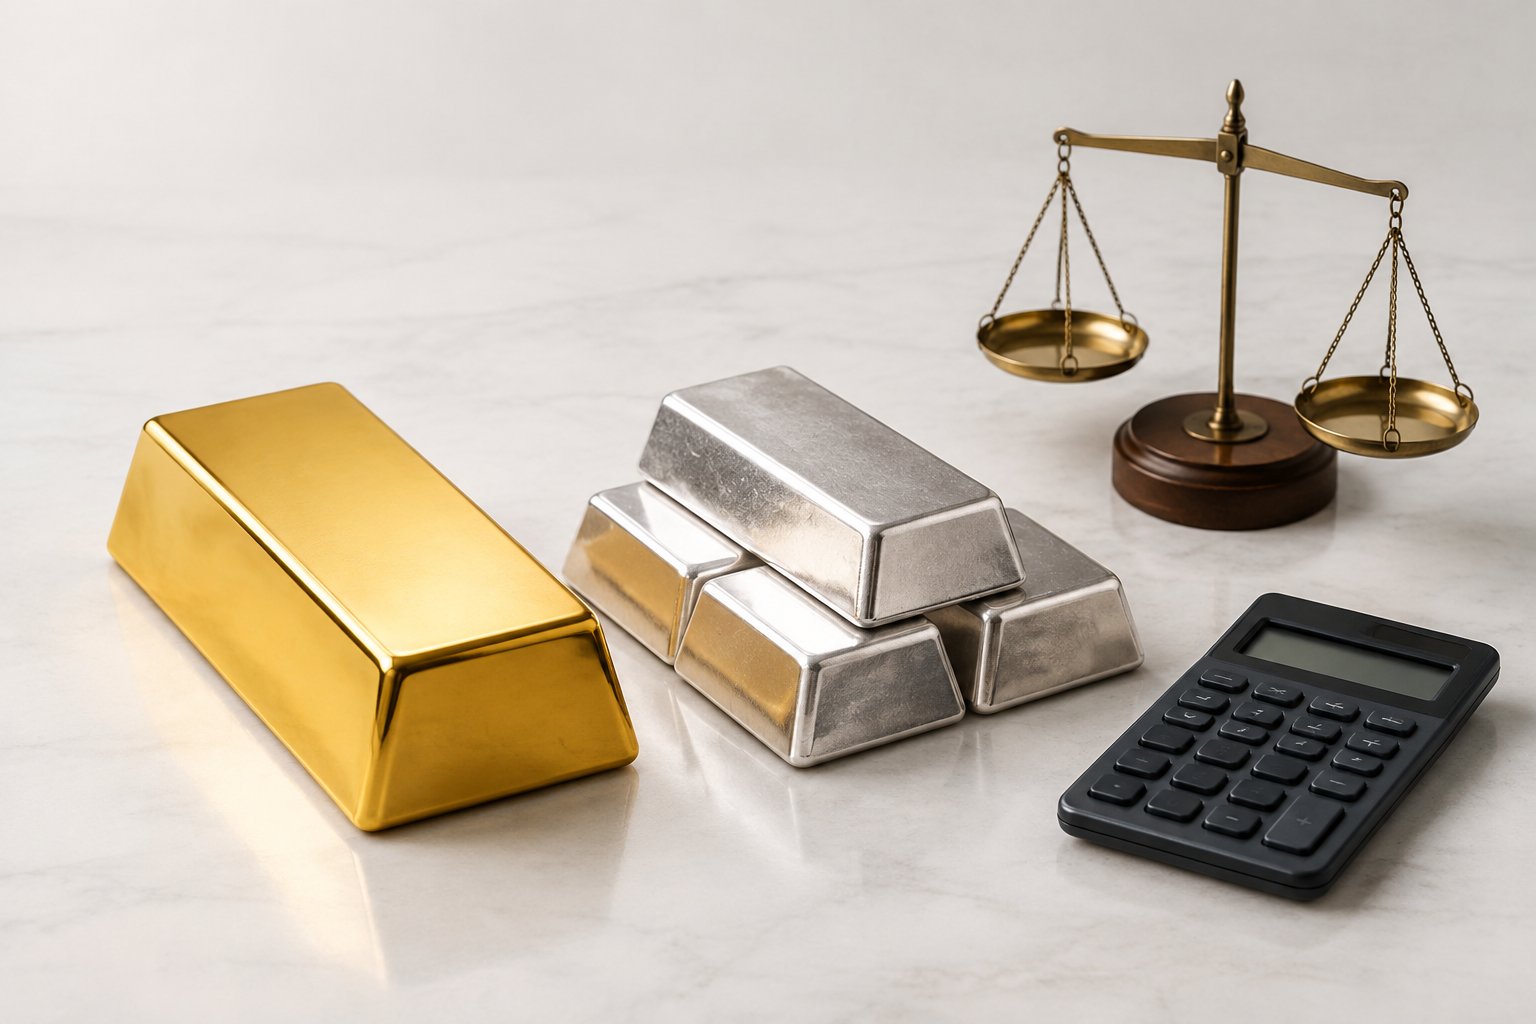
You calculate the ratio by dividing the gold spot price by the silver spot price, using matching units and quotes taken at the same time.
Divide Gold’s Spot Price by Silver’s Spot Price
Use this formula:
Gold/silver ratio = gold spot price per troy ounce ÷ silver spot price per troy ounce
For a hypothetical calculation, suppose you see a gold price of $1,500 per troy ounce and a silver price of $15 per troy ounce. Your calculation is $1,500 ÷ $15 = 100, written as 100:1.
You might also see the abbreviation GSR. Whichever label you use, keep both quotes in the same currency and weight unit. Mixing a gold quote per ounce with a silver quote per kilogram produces a meaningless result.
As you follow what causes spot prices to rise, refresh both prices together. Combining a current gold quote with yesterday’s silver close distorts your comparison.
What Does an 80:1 Ratio Mean?
At 80:1, you need silver worth 80 troy ounces at spot to match the spot value of one troy ounce of gold. You are comparing equal dollar values expressed in different metal weights.
You should also separate this market relationship from physical scarcity. An 80:1 reading gives you no direct measurement of underground reserves or annual mining output.
If you hold coins or bars, your dealer’s exchange terms will differ from that headline figure. Product premiums and buyback prices enter the calculation when you trade.
What Do High and Low Readings Tell You?
You read a high gold-silver ratio as gold being expensive relative to silver, while a low reading indicates the reverse. To interpret either reading, you need a comparison period and a reason to expect the relationship to change.
How Does the 80/50 Rule Describe Relative Value?
Under the informal 80/50 convention, you treat readings above 80 as a reason to examine silver’s relative cheapness and readings below 50 as a reason to examine gold’s relative cheapness. These thresholds are reference points, not validated trading triggers.
Before deciding whether silver is undervalued, ask what explains the reading. Strong demand for gold might support an elevated ratio for an extended period.
You also need to distinguish relative value from absolute value. Silver might look inexpensive against gold while both metals trade at prices you consider unattractive compared with your other investment choices.
Why Can the Ratio Rise When Both Metals Fall?
You get a rising ratio whenever gold outperforms silver in percentage terms, including periods when both metals lose dollar value. If silver prices fall proportionally faster than gold prices, the denominator shrinks faster and the ratio increases.
The reverse also holds: you get a falling ratio when silver outperforms gold, even during a broad decline. Direction alone therefore tells you little about the dollar return on either holding.
When reviewing gold and silver prices, check each metal’s percentage change alongside the ratio. That separates relative performance from the gain or loss in your account.
Why Does the Ratio Change?
You see the ratio change because gold and silver respond differently to investment demand and economic conditions. Your gold vs silver comparison becomes more useful when you account for gold’s monetary role and silver’s industrial exposure.
How Do Safe-Haven Demand and Interest Rates Affect Gold?
During financial stress, you might see investors seek gold for its liquidity and perceived defensive qualities. Central-bank purchases also influence the amount available to other buyers.
You can put that demand in historical context: central banks have been net buyers of gold since 2008. Sustained official purchases provide a reason for gold to outperform even when silver’s investment demand remains healthy.
You should watch inflation-adjusted interest rates because bullion pays no interest. Higher real yields increase the opportunity cost of holding gold; lower real yields reduce it. Your assessment also benefits from tracking how dollar strength affects gold prices, since US-dollar movements influence affordability for overseas buyers.
How Do Industrial Demand and Volatility Affect Silver?
With silver, you have exposure to industrial demand alongside investment demand. Electronics and solar manufacturing create a different demand profile from gold’s.
During an industrial slowdown, weaker consumption expectations put pressure on silver. During an expansion, stronger manufacturing demand supports it, although substitution and changes in material efficiency also affect consumption.
You should account for why silver is more volatile than gold before increasing your allocation. Its sharper price movements amplify changes in the ratio and increase the size of potential losses while you wait for a relative-value thesis to work.
How Has the Ratio Changed Throughout History?
You need to separate legally fixed monetary ratios from freely traded market ratios when comparing history. A government’s coinage rule and a modern market quotation reflect different pricing systems.
Why Did the US Coinage Act of 1792 Set a 15:1 Ratio?
Under the US Coinage Act of 1792, you had a statutory relationship of 15 units of silver to one unit of gold by pure-metal weight. The law established a bimetallic monetary system in which both metals supported US coinage.
You can view that ratio as a rule for assigning monetary value to coins. The choice broadly reflected prevailing relative valuations and supported a system using both metals as money.
As you examine the history of money, distinguish legal value from market value. When those diverged, holders had incentives to spend the legally overvalued metal and retain or export the undervalued one.
What Changed Under Fiat Currency?
Under fiat currency, you use money without a promise of redemption for a fixed weight of gold or silver. The US transition unfolded through several changes, including restrictions on domestic gold redemption in 1933 and the end of dollar-to-gold convertibility for foreign official holders in 1971.
You now calculate the gold silver ratio from independently traded prices. Supply disruptions and changes in demand move those prices without a legal requirement to preserve a particular relationship.
That shift limits comparisons with old mint ratios. You have no monetary mechanism forcing today’s market back to the 1792 standard.
What Do the 1980, 2011, and 2020 Extremes Show?
You see markedly different relationships around major market disruptions: roughly 15:1 during the 1980 precious-metals surge, about 31:1 in April 2011, and above 120:1 during the March 2020 market shock. Treat these as approximate event-period readings, not annual averages.
When you compare these episodes, the historical ratio chart offers observations extending back to 1915. Your exact extreme depends on whether you use daily closing prices, benchmark prices, or synchronized intraday quotes.
You should therefore avoid mixing an intraday peak with an annual average. These episodes demonstrate a wide range of outcomes; they give you no dependable timetable for a return to an earlier level.
How Can Investors Use the Ratio Without Overrelying on It?
You can use the gold-to-silver ratio to evaluate allocation changes, provided you calculate executable prices and define your risk limits. For precious metals investors holding bullion, the practical question is how many ounces remain after the full exchange.
How Does a Gold-to-Silver Swap Work?
In a ratio swap, you sell one metal and use the proceeds to buy the other. Your objective is to increase your eventual metal holdings through a favorable change in relative prices.
Consider this hypothetical, cost-free example:
- You hold one ounce of gold when gold is $1,500 and silver is $15, producing a 100:1 ratio.
- You exchange that ounce for 100 ounces of silver.
- Later, gold is $1,000 and silver is $20, producing a 50:1 ratio.
- You exchange your 100 silver ounces for two gold ounces.
You have doubled your theoretical gold ounces. Your result requires both a favorable ratio change and cost-free execution, so it is useful arithmetic for evaluating a strategy, not a forecast.
How Do Premiums and Dealer Spreads Change the Math?
Your executable result uses the dealer’s bid, the price paid to you, and ask, the price charged to you. The difference is the dealer spread; retail prices also reflect gold and silver premiums above spot.
Apply these explicitly hypothetical transaction terms to the same swap:
| Transaction detail | First exchange | Return exchange |
|---|---|---|
| Spot prices, gold / silver | $1,500 / $15 | $1,000 / $20 |
| Dealer buys your metal | Gold: $1,470/oz | Silver: $19/oz |
| Dealer sells replacement metal | Silver: $16/oz | Gold: $1,050/oz |
| Shipping and insurance | $30 | $30 |
On the first exchange, you receive ($1,470 − $30) ÷ $16 = 90 silver ounces. On the return exchange, you receive (90 × $19 − $30) ÷ $1,050 = 1.6 gold ounces.
Your theoretical two ounces have become 1.6 ounces before applicable taxes. This illustration assumes fractional quantities are available; actual bar and coin denominations might leave cash uninvested.
For a taxable purchase, include sales tax in your replacement-metal cost. You should also check income-tax consequences: exchanging investment metals generally involves a taxable disposition for US federal purposes, even if you immediately reinvest the proceeds. Before you sell gold or silver, obtain firm quotes and record your cost basis.
Why Is Mean Reversion Not Guaranteed?
You face mean-reversion risk because the relationship between the metals changes over time. A historical average depends on the chosen dates and observation frequency, and it creates no obligation for future prices.
If you exchange gold for silver at a high ratio and the ratio keeps rising, your silver buys less gold when you reverse the trade. Waiting longer also brings storage costs and the opportunity cost of holding the position.
Before swapping, write down your intended exit conditions and maximum allocation. You can also direct new purchases toward your preferred metal, avoiding a sale of existing holdings and its associated transaction costs.
Use the Ratio for Context, Not Certainty
You get the most useful context from the ratio when you pair its relative-value signal with current dealer quotes and your investment goals. Calculate it using synchronized spot prices, then evaluate any proposed trade using the bid and ask available to you.
Keep your precious metals allocation consistent with your broader portfolio diversification plan. Before exchanging bullion, calculate the ounces you would receive after premiums, shipping, and applicable taxes, and decide how much adverse movement you are prepared to accept.