Geopolitical flare-ups in and around Iran push you to rethink where to park capital, especially in precious metals. Expect safe-haven demand to lift gold and, to a lesser extent, silver and palladium—driving short-term price spikes while supply risks and market positioning determine the size and duration of those moves.
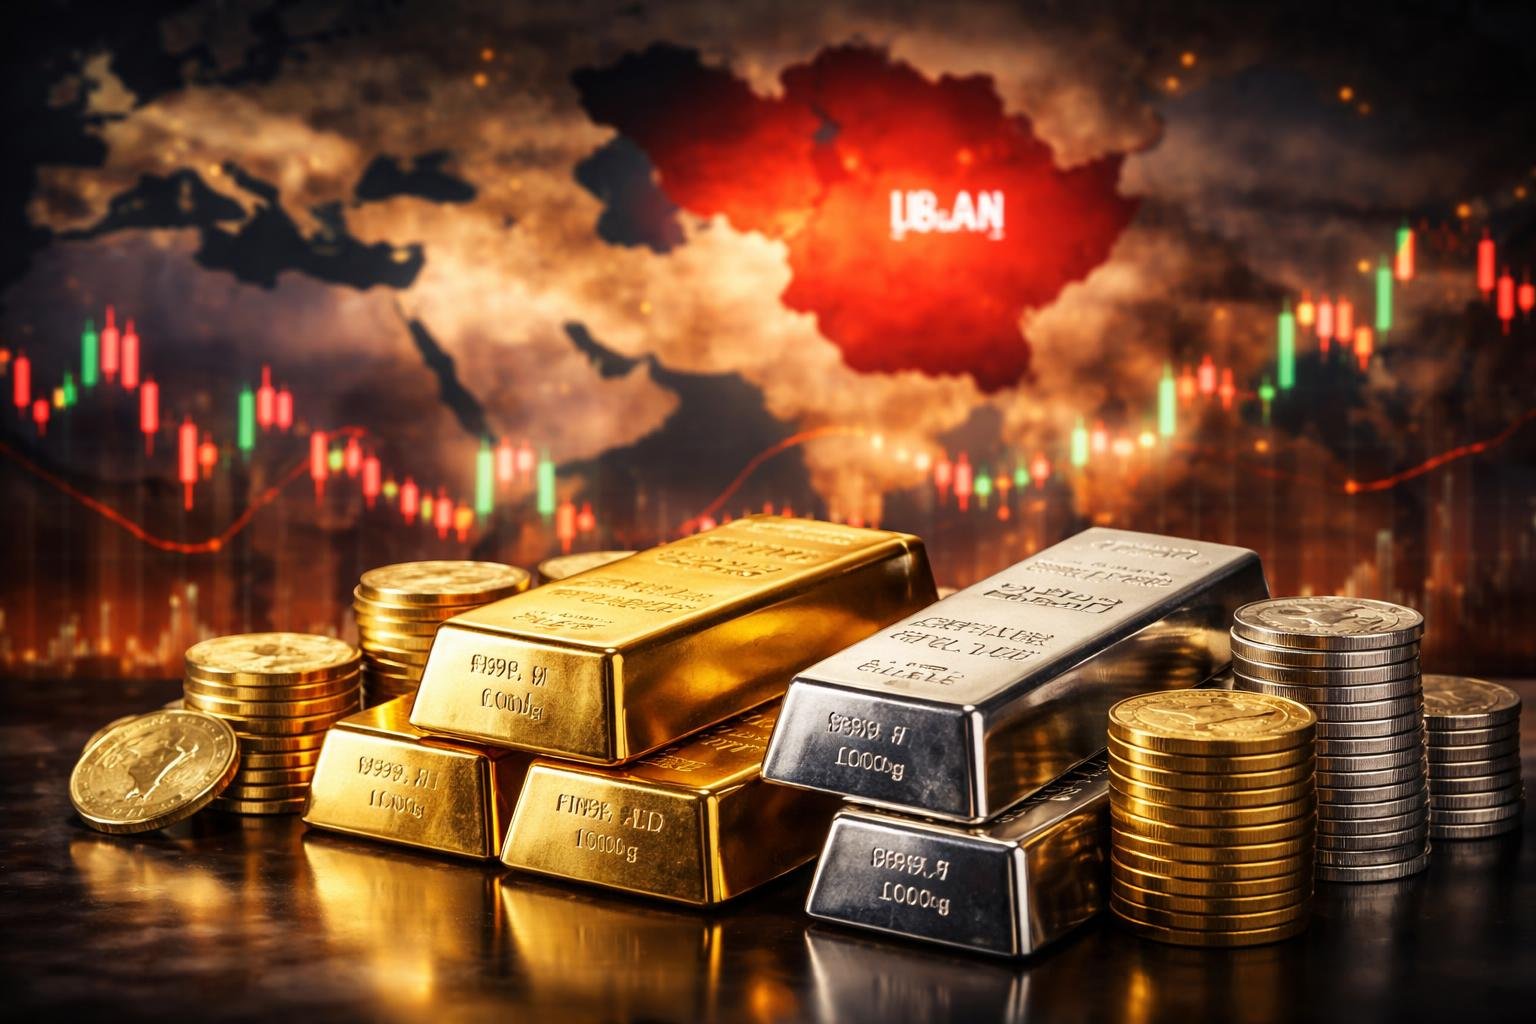
You will explore how supply-chain disruptions (think Strait of Hormuz risk and mine-region exposures), investor flows into COMEX and ETFs, and macro drivers such as inflation and currency swings interact to shape prices. The article breaks down immediate price reactions, how other precious metals typically behave, and the scenarios that turn a temporary surge into a sustained trend, so you can gauge risk and opportunity.
Overview Of The Iran Conflict

You will find the conflict’s roots, the present escalation points, and the main regional and global actors laid out below. This context shows why markets—especially precious metals—react to developments in and around Iran.
Historical Background
Iran’s modern geopolitical posture stems from the 1979 Islamic Revolution, which replaced a US-aligned monarchy with a theocratic republic. That shift produced decades of adversarial relations with the United States, punctuated by sanctions, diplomatic isolation, and proxy confrontations across the Middle East.
The 2000s added new drivers: Iran’s nuclear program prompted international negotiations and waves of sanctions, while regional rivalries with Saudi Arabia and Israel intensified through support for proxy groups in Lebanon, Yemen, Syria, and Iraq. These threads—ideology, nuclear ambitions, and regional competition—create recurring market-sensitive flashpoints you should watch.
Current State Of Tensions
Since late 2025 and into 2026, coordinated US-Israel strikes on Iranian targets and retaliatory actions have escalated the crisis. You should note increased military strikes, maritime incidents, and disruptions to air and shipping routes across the Gulf and Red Sea corridors.
Sanctions remain in force and have tightened in response to attacks, worsening Iran’s economic strain and raising the risk of supply-chain disruptions for energy and precious metals transit hubs. Markets respond to each new incident with volatility; precious metals often jump on immediate risk and then adjust as clarity emerges.
Geopolitical Stakeholders
Your assessment must include regional powers and global actors. The United States and Israel lead the coalition pressing Iran, citing nuclear and missile threats. Saudi Arabia, the UAE, and other Gulf states balance security ties with Western partners against economic dependence on regional trade routes.
Russia and China offer diplomatic and economic support to Iran, limiting the effectiveness of Western pressure and adding complexity to sanctions enforcement. Non-state actors—Hezbollah, Houthi forces, and various militias—serve as force multipliers that can disrupt oil and trade flows, making supply-risk calculations more uncertain for investors in gold and silver.
Direct Impact Of The Iran Conflict On Precious Metals

Tightening supply routes, sudden risk aversion, and rapid portfolio reallocations have driven recent metal price moves. Expect sharper intraday swings, increased investment flows into bullion and miners, and periodic dislocations between physical and paper markets.
Market Volatility And Uncertainty
You will see spikes in intraday volatility when new military actions, sanctions, or shipping disruptions hit headlines. Liquidity thins during risk events, which amplifies price moves on both COMEX futures and spot markets for gold, silver, and palladium.
- Price gaps and wider bid-ask spreads become common during early trading after major developments.
- Physical market premiums can diverge from futures prices when shipping through the Strait of Hormuz or regional refining capacity is threatened.
Volatility also differs by metal. Gold typically reacts fastest as a liquid safe asset, while silver and industrial metals like copper and palladium show larger percentage swings when supply-chain concerns arise. You should expect elevated realized volatility and higher implied volatility priced into options for weeks after escalations.
Safe Haven Demand For Gold
When conflict intensifies, institutional and retail buyers increase allocations to physical gold and exchange-traded products. You will notice ETF inflows and higher central-bank buying as capital seeks stores of value independent of any single currency.
- Short-term drivers: flight-to-safety flows into bullion, currency hedging, and liquefaction of risky equity positions.
- Medium-term drivers: strategic inventory rebuilding by funds and miners’ share outperformance.
Physical demand can strain allocated bullion inventories, pushing spot premiums up relative to futures. Gold’s role as a portfolio diversifier means its price often rises even if inflation expectations or interest-rate paths remain unchanged. You should track vault inventories, ETF holdings, and sovereign purchases to gauge how sustained the safe-haven bid may be.
Investor Sentiment Shifts
Sentiment shifts quickly from risk-on to risk-off, altering demand across metals and mining equities. You will see rotation into staples, infrastructure plays, and precious-metals miners, while cyclicals and small cap miners lag.
- Sentiment metrics: VIX, gold-oil correlation changes, and fund flows indicate how persistent risk aversion will be.
- Market positioning: leveraged futures longs can force sharp corrections if sentiment reverses, magnifying drawdowns in silver and miners.
Analysts’ price-adjustment forecasts (e.g., percentage uplifts tied to conflict scenarios) reflect differing assumptions about duration and escalation. You should monitor positioning data, options skew, and miner balance-sheet strength to anticipate how sentiment-driven flows will sustain or reverse metal price moves.
Gold Price Reactions To Geopolitical Tensions
Gold typically reacts quickly to spikes in geopolitical risk, moving higher as investors shift into safe havens, while supply-chain or trade disruptions can push oil and inflation expectations—factors that further support bullion prices.
Historical Gold Price Movements
You can see clear patterns from past conflicts: safe-haven flows appear within days and can persist for weeks.
For example, during major Middle East escalations and the US-Iran flare-ups, gold rose sharply as equities fell and bond yields dropped. This reflects portfolio rebalancing toward assets that preserve capital.
Price moves often show a two-stage dynamic. First-week spikes of 5–15% are common when the market prices immediate risk. Subsequent weeks may bring consolidation or further gains depending on conflict duration and broader macro signals like US real yields and dollar strength.
Retail and institutional demand diverge in these episodes. ETFs and bullion bars typically absorb flows quickly, while miners’ stocks lag due to operational and sentiment factors. Monitor real rates, oil price shifts, and central-bank commentary to gauge whether the initial jump will extend.
Price Forecasts Amid Iran Conflict
You should expect near-term upside if hostilities continue or widen. Analysts have modeled scenarios where renewed escalation could push gold another 10–20% from recent peaks within weeks, driven by safe-haven buying and inflationary pressure from higher oil prices.
Conversely, de-escalation or clear diplomatic paths tend to trim those gains rapidly. In that case, gold may retrace a large portion of the spike as risk premia unwind and liquidity returns to risk assets.
Key indicators to watch: U.S. real yields, dollar index, oil prices, and net inflows into gold ETFs. Use a scenario approach: base case (short flare-ups) = modest, temporary gains; stress case (protracted regional war) = sustained rally; resolution case = pullback toward pre-crisis levels.
Silver, Platinum, And Palladium In The Wake Of Escalation
Escalation shifts both investment flows and industrial inputs for these metals. Expect demand patterns to diverge: silver reacts to safe‑haven buying and industrial slowdowns, while platinum and palladium respond to regional supply disruptions and automotive market shifts.
Industrial Versus Investment Demand
Silver carries a dual role: an industrial commodity and an investment asset. You should watch electronics, solar PV, and chemical uses because a slowdown in manufacturing reduces industrial silver offtake and can weaken prices even as investors buy physical silver and ETFs during geopolitical stress. Price moves will therefore reflect the balance between falling industrial consumption and rising safe‑haven purchases.
Platinum and palladium are much more manufacturing‑centric, dominated by auto catalytic converters and industrial catalysts. If vehicle production in Europe and Asia slows, palladium demand can drop quickly, pressuring prices. Conversely, persistent investor interest in palladium or substitution toward platinum for technical or regulatory reasons can tighten markets and lift prices.
Key signals to monitor:
- weekly metal inventories and ETF flows;
- auto production indices and semiconductor supply data;
- solar panel silver demand and electronics output figures.
Regional Supply Chain Risks
Supply concentration matters for platinum group metals. South Africa supplies most platinum and a large share of palladium; any port disruption, strikes, or power outages there quickly tighten physical markets. You should track shipping through the Cape and regional labor actions because even short disruptions can cause outsized price responses.
Iran‑related escalation threatens shipping through the Strait of Hormuz and raises insurance costs for tankers and raw material shipments. Higher freight and rerouting can delay shipments of refined silver and PGM shipments from refineries in Europe and the Middle East, increasing short‑term volatility. Watch refinery run rates, insurance premium spikes, and port congestion reports to anticipate supply squeezes that could drive near‑term price spikes.
Macro-Economic Factors Amplifying Effects
Short-term supply shocks and policy responses interact with inflation expectations and interest-rate decisions to shape precious metals prices. You should watch currency moves and central bank actions closely because they determine real returns and demand for gold and silver.
Inflation And Currency Movements
Rising oil prices or disrupted Gulf flows tend to lift inflation expectations, which increases real demand for precious metals as inflation hedges. If consumer-price indexes accelerate, gold often gains because your nominal bonds and cash lose purchasing power while gold retains real value.
Currency strength matters too. A weaker US dollar makes dollars-priced metals cheaper for overseas buyers, boosting global physical demand and ETF flows. Conversely, a stronger dollar can cap metal rallies even amid geopolitical risk. Watch real broad-dollar indices and break-evens (5–10 year) for signals: higher break-evens + falling dollar = supportive backdrop for gold and silver.
You should also track emerging-market currencies. Countries with high import bills or tourism exposure may see sharp currency drops, forcing local investors into hard assets like gold, which can amplify regional buying and move global prices higher.
Central Bank Policies
Central bank stance on interest rates directly affects opportunity cost of holding non-yielding metals. When major central banks pause hikes or pivot to easing in response to slower growth, real rates can fall and gold typically benefits. Monitor Fed dot plots, ECB guidance, and Bank of England commentary for timing.
Quantitative easing, balance-sheet expansion, or large sovereign purchases of gold change supply-demand dynamics. If central banks increase gold reserve accumulation—common during geopolitical uncertainty—that provides structural support to prices. Conversely, aggressive tightening that raises real yields tends to pressure precious metals.
You should also consider liquidity and repo conditions. Tight funding conditions can temporarily force liquidation of metal-backed ETFs, weighing on prices despite a favorable macro narrative.
Global Investor Strategies In Response To Iran Conflict
You should expect higher market volatility, rising safe-haven demand, and potential supply-driven moves in energy and commodity prices. Positioning choices below focus on reducing portfolio downside while keeping exposure to upside from precious metals.
Portfolio Diversification
Diversify across asset classes that respond differently to geopolitical shocks. Hold a mix of short-term cash or cash equivalents, nominal and real-yielding bonds, commodity exposure, and a tactical allocation to precious metals to smooth returns during spikes in uncertainty.
Use geographic diversification to avoid concentrated risk tied to regional trade or energy routes. Add equities in sectors less sensitive to energy costs (technology, healthcare) alongside cyclical inflation beneficiaries (materials, miners). Employ position sizing limits—keep any single country or commodity weighting below a predetermined percent of your portfolio to control drawdowns.
Rebalance more frequently during acute phases of the conflict. Set target bands (for example ±3–5%) and use limit orders to capture drift without trading on headline noise. Consider low-cost ETFs for rapid implementation and liquidity.
Hedging With Precious Metals
Tangible metals typically gain when real yields fall and risk sentiment deteriorates. Allocate to both physical bullion and liquid instruments (ETFs, futures) to balance insurance-like protection with tradability and cost efficiency.
Use gold as a core hedge for systemic risk and silver or platinum for tactical plays linked to industrial demand and supply disruption. Size your hedge based on volatility scenarios—stress-test allocations against a 10–25% move in gold and simulate the impact on portfolio VaR.
Manage storage, counterparty, and liquidity risks: if you choose physical metal, confirm insured storage and clear documentation; if you use ETFs or futures, monitor roll costs and margin requirements. Layer protective positions with stop-loss rules to limit hedging costs when sentiment normalizes.
Potential Scenarios And Long-Term Outlook
Key drivers will be the conflict’s geographic spread, duration, and impact on oil flows and investor risk appetite. Those variables will determine whether precious metals act as short-term havens or enter a sustained uptrend tied to inflation and monetary responses.
Escalation Versus De-Escalation
If the conflict escalates to include attacks on Gulf shipping or wider regional strikes, you can expect a sharper, faster rise in gold and silver prices. Higher oil and shipping-risk premia usually increase inflation expectations and push investors toward physical metals and bullion ETFs. Central banks in affected regions may also buy or sell reserves, which would shift supply-demand dynamics.
If tensions remain contained or de-escalate through diplomacy, the initial safe-haven bid often fades within weeks. In that case, precious metals prices typically retrace part of their gains as real yields stabilize and equities recover. Watch for sustained central-bank buying, mine supply disruptions, or a prolonged risk premium—any of those can preserve higher price levels even without active conflict.
Market Recovery Timelines
Rapid de-escalation usually brings a market normalization window of 4–8 weeks for gold and silver, with volatility falling first and prices drifting lower next. You should look at bond yields and oil prices as leading indicators: falling oil and rising real yields generally precede metal pullbacks.
In a protracted conflict, the recovery timeline lengthens to months or years. Persistent supply constraints, sustained higher oil prices, or weaker growth that prompts unconventional monetary policy can all support a multi-quarter elevated metal price regime. Consider scenario-based position sizing: short-term hedges for volatility, and staggered long-term allocations if inflation or reserve-buying trends strengthen.
Conclusion
You should expect precious metals to remain sensitive to developments in the Iran conflict, with gold and silver reacting fastest to risk spikes and supply concerns. Price moves will likely be sharp but intermittent, driven by news flow, market positioning, and physical demand.
Assessments of magnitude vary, so plan for a range of outcomes: modest safe‑haven bids (single‑digit percent moves) to larger rallies if supply routes or regional escalation threaten trade and mining operations. Central bank policy, dollar strength, and inflation trends will either amplify or temper those moves.
Manage risk by keeping position size, liquidity needs, and time horizon explicit. Use layered entries and stop levels rather than betting on a single directional outcome. Consider physical allocation and short‑dated hedges if you need immediate protection.
Watch three practical signals closely: real disruptions to shipping/mining, clear shifts in monetary policy, and sustained investor flows into bullion and ETFs. Those signals will tell you whether a temporary spike is becoming a structural repricing.
If you need, create a checklist mapping each signal to an actionable step for your portfolio. That keeps emotion out of trading and aligns responses with your objectives and risk tolerance.